Course Overview
Microsoft Excel: Power Query, Power Pivot & Interactive Dashboards
In today’s data-driven environment, professionals are expected to handle large volumes of data efficiently and turn them into meaningful insights. Traditional Excel skills are no longer sufficient when dealing with complex datasets.
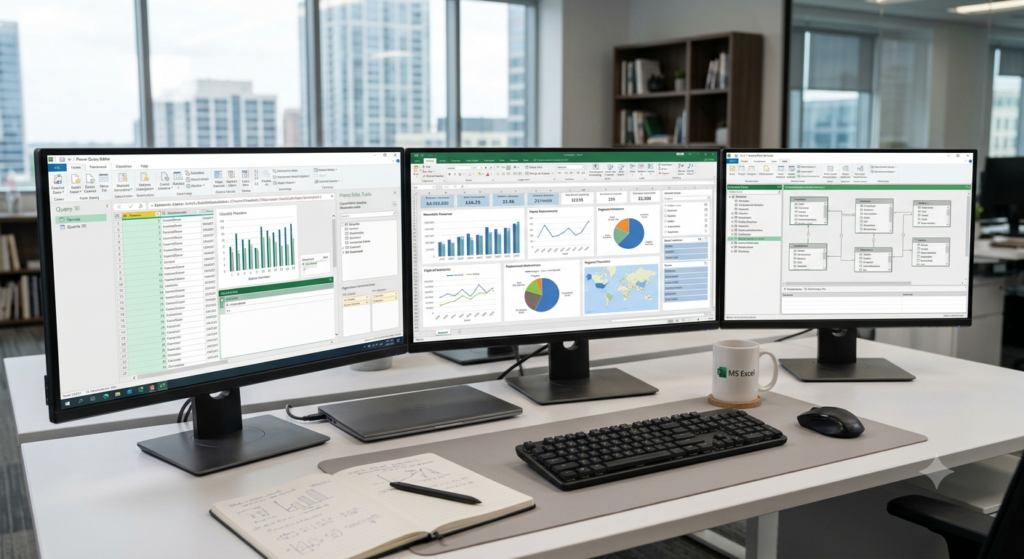
This 2-day hands-on course introduces participants to Power Query for data transformation, Power Pivot for data modelling, and Dashboard design techniques for interactive reporting. Participants will learn how to automate data cleaning, build relationships between multiple datasets, and create dynamic dashboards for better decision-making.
The course is designed with real-world business scenarios, enabling participants to apply what they learn immediately in their workplace.
Course Objectives
By the end of this course, participants will be able to:
Power Query (Data Transformation)
Import data from multiple sources (Excel, CSV, etc.)
Clean and transform messy datasets efficiently
Automate repetitive data preparation tasks
Combine and reshape datasets (merge, append)
Power Pivot (Data Modelling)
Understand data modelling concepts
Create relationships between tables
Build a structured data model for reporting
Perform basic data aggregation without complex formulas
Dashboards (Visualization & Reporting)
Create interactive dashboards using PivotTables & charts
Design user-friendly reports with slicers and timelines
Apply best practices in dashboard layout and storytelling
Present insights clearly for business decision-making
Who Should Attend
Executives, Analysts, Finance, HR, Operations
Anyone working with large Excel datasets
Users familiar with basic Excel (formulas, tables, PivotTables)
Course Content
Day 1: Power Query & Data Preparation
Module 1: Introduction to Modern Excel Tools
Limitations of traditional Excel
Overview of Power Query, Power Pivot, Dashboards
Understanding data workflow (Extract → Transform → Load)
Module 2: Getting Started with Power Query
What is Power Query?
Interface and navigation
Importing data from:
Excel files
CSV/Text files
Understanding query steps
Module 3: Data Cleaning Techniques
Removing duplicates
Handling missing values
Splitting and merging columns
Changing data types
Formatting text (Trim, Upper, Lower)
Module 4: Data Transformation
Filtering and sorting data
Pivoting and unpivoting columns
Grouping and summarizing data
Adding custom columns
Module 5: Combining Data
Append queries (stacking data)
Merge queries (joining tables)
Working with multiple datasets
Module 6: Automation with Power Query
Refreshing data automatically
Managing query dependencies
Best practices for reusable queries
Day 2: Power Pivot & Dashboard Development
Module 7: Introduction to Power Pivot
What is Power Pivot?
Data model vs normal Excel tables
Loading data into Data Model
Module 8: Data Modelling Concepts
Creating relationships between tables
Primary key vs foreign key
Star schema (basic understanding)
Managing multiple tables
Module 9: Data Analysis with PivotTables
Creating PivotTables from Data Model
Using multiple tables in one report
Advanced filtering techniques
Creating calculated summaries (without DAX focus)
Module 10: Dashboard Design Principles
What makes a good dashboard?
Choosing the right charts
Layout and visual hierarchy
Avoiding common design mistakes
Module 11: Building Interactive Dashboards
Creating charts from PivotTables
Adding slicers and timelines
Connecting multiple visuals
Creating dynamic reports
Module 12: Final Dashboard Project
Build a complete dashboard from raw data
Apply:
Power Query (data cleaning)
Power Pivot (data modelling)
Dashboard visualization
Course Details
Duration
2 Days (9:00 AM – 5:00 PM)