Course Overview
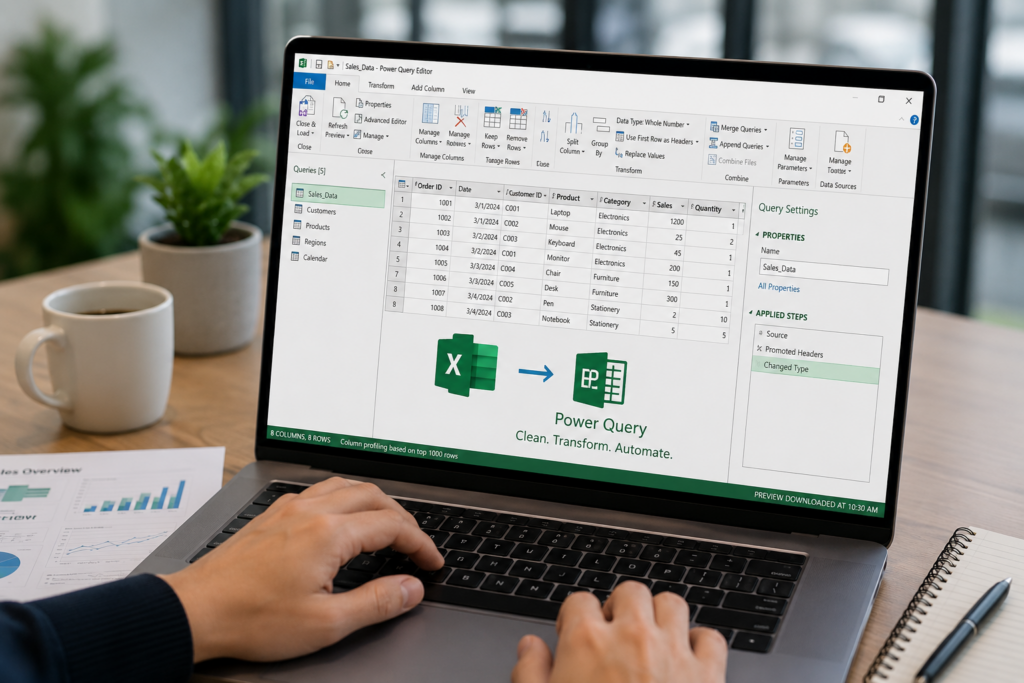
This 1-day hands-on course equips participants with practical Power Query skills to connect, clean, transform, and automate data from multiple sources — without writing complex formulas. Participants will learn how to build reusable, refresh-ready queries that save hours of manual data processing every week. Ideal for professionals who regularly work with messy, inconsistent, or multi-source data and want to build efficient, automated reporting workflows in Excel.
Course Objectives
- Understand the Power Query Editor interface and core concepts
- Connect to multiple data sources including Excel, CSV, folders, and web
- Clean and transform messy data using Power Query tools
- Merge and append data from multiple tables into a single unified dataset
- Build reusable, automated queries that refresh with one click
- Apply best practices for building scalable, maintainable data pipelines
Training Methodology
- 70% Hands-on Exercises
- 20% Guided Demonstrations
- 10% Real-World Case Studies and Group Discussions
Who Should Attend
- Executives, Analysts, and Admin staff who process data regularly
- HR, Finance, Sales, and Operations professionals
- Excel users who want to eliminate repetitive manual data cleaning
- Anyone who consolidates reports from multiple files or systems
Learning Outcomes
By the end of this course, participants will be able to:
| • Connect to and import data from multiple sources confidently • Clean and standardise messy, inconsistent datasets with ease • Merge and append data across multiple tables and files | • Automate recurring data preparation tasks with one-click refresh • Build professional, reusable queries for ongoing reporting • Reduce manual data processing time by up to 80% |
Course Content
| Module 1: Introduction to Power Query 9:00 AM – 9:45 AM |
Why Power Query?
- The problem with manual data cleaning: time, errors, and repetition
- What Power Query is and how it fits into the Excel ecosystem
- Power Query vs formulas vs VBA — when to use each
- Real-world business scenarios where Power Query saves hours
The Power Query Interface
- Launching Power Query Editor from Excel
- Understanding the interface: Query pane, Preview pane, Applied Steps
- The ribbon: Home, Transform, Add Column, View tabs
- How Applied Steps work — every action is recorded and repeatable
| ✏️ Activity: Launch Power Query from Excel, connect to a sample CSV file, and explore the interface. Identify at least 3 data quality issues in the preview pane. |
| Module 2: Connecting to Data Sources 9:45 AM – 10:45 AM |
Supported Data Sources
- Connecting to Excel workbooks (single sheet and multiple sheets)
- Importing CSV and text files with delimiter detection
- Connecting to a folder to combine multiple files automatically
- Importing data from a web URL or SharePoint list
Managing Connections
- Understanding load options: Load to Table, PivotTable, or Data Model
- Connection-only queries vs loaded queries
- Setting the file path for portability and team sharing
- Data source settings and updating file paths
| ✏️ Activity: Connect to a folder containing 12 monthly sales CSV files. Let Power Query automatically combine all files into a single unified table — without copy-pasting. |
| Morning Break 10:45 AM – 11:00 AM |
| Module 3: Data Cleaning & Transformation 11:00 AM – 12:30 PM |
Essential Cleaning Operations
- Promoting headers and setting correct data types
- Removing duplicates, blank rows, and irrelevant columns
- Trimming whitespace and fixing inconsistent capitalisation (TRIM, CLEAN, PROPER equivalents)
- Replacing and correcting values across entire columns
- Splitting columns by delimiter, position, or character count
- Merging columns into a single field (e.g. Full Name from First + Last)
Reshaping Data
- Filtering rows by condition — keeping what you need
- Sorting data for structured output
- Pivoting and unpivoting columns to reshape data structure
- Grouping rows to create summary aggregations (SUM, COUNT, AVERAGE)
- Transposing tables from wide to tall or tall to wide format
| ✏️ Activity: Clean a messy HR dataset: fix data types, remove duplicates, trim names, split a combined address column, and unpivot monthly KPI columns into a proper row-based format. |
| Module 4: Adding Calculated Columns & Conditional Logic 12:30 PM – 1:00 PM |
Custom Columns
- Adding a Custom Column using basic M language expressions
- Arithmetic operations across columns (e.g. Profit = Revenue – Cost)
- Conditional Column — the IF/ELSE logic builder (no coding required)
- Date calculations: extracting Year, Month, Quarter, Day of Week
- Text-based columns: combining, extracting, and reformatting
| ✏️ Activity: Add three calculated columns to a sales dataset: Total Revenue (Qty × Price), Profit Margin %, and a Performance Category using Conditional Column logic (High / Medium / Low). |
| Lunch Break 1:00 PM – 2:00 PM |
| Module 5: Merging & Appending Queries 2:00 PM – 3:15 PM |
Append Queries — Stacking Tables
- When to use Append: combining data with the same structure
- Appending two queries — e.g. Jan + Feb + Mar into one dataset
- Appending multiple queries in a single step
- Handling mismatched column names across sources
Merge Queries — Joining Tables
- When to use Merge: looking up related data from another table
- Join types: Left Outer, Inner, Full Outer, Anti Join — practical differences
- Merging a Sales table with a Product Master to bring in product names and categories
- Merging an Employee table with a Department table to enrich HR data
- Expanding merged columns to select only the fields you need
| ✏️ Activity: Merge a Sales transactions table with a Customer master table and a Product lookup table in two steps. Bring in Customer Region and Product Category, then group by Region and Category to produce a summary report. |
| Afternoon Break 3:15 PM – 3:30 PM |
| Module 6: Automation, Refresh & Query Management 3:30 PM – 4:15 PM |
One-Click Refresh
- How Power Query remembers every step — the Applied Steps log
- Refreshing a single query vs refreshing all queries
- Setting up automatic refresh on file open
- Parameterising file paths for dynamic folder locations
Query Management Best Practices
- Naming queries clearly for long-term maintenance
- Organising queries into groups (staging, transformation, output)
- Disabling load for intermediate queries to keep Excel clean
- Documenting steps with renamed Applied Steps
- Troubleshooting errors: understanding red error rows and step failures
| ✏️ Activity: Set up a fully automated monthly report pipeline: folder-based source, combined and cleaned query, merge with master data, load to a formatted Excel table — then simulate a refresh by adding a new monthly file to the folder. |
| Module 7: Final Project & Wrap-Up 4:15 PM – 5:00 PM |
Final Hands-On Project
- Participants will build a complete automated data pipeline using provided business datasets:
- Connect to a folder of monthly transaction files
- Clean and standardise the combined dataset
- Add calculated columns (revenue, margin, category)
- Merge with a Product and Customer master table
- Group and summarise into a final reporting table
- Refresh the entire pipeline to confirm automation works
Wrap-Up & Q&A
- Key Power Query tips participants can apply immediately
- Common mistakes to avoid in production queries
- Q&A and open discussion with the trainer
- Certificate of Completion distribution